
 Contact
 Comment faire ses achats
Livraison
Guide d'achat
#MakeoverMonday
 Anglais
 85 b
85 b
Les clients ont également acheté



 /
/
 Livre de poche
 17.38
€
17.38
€

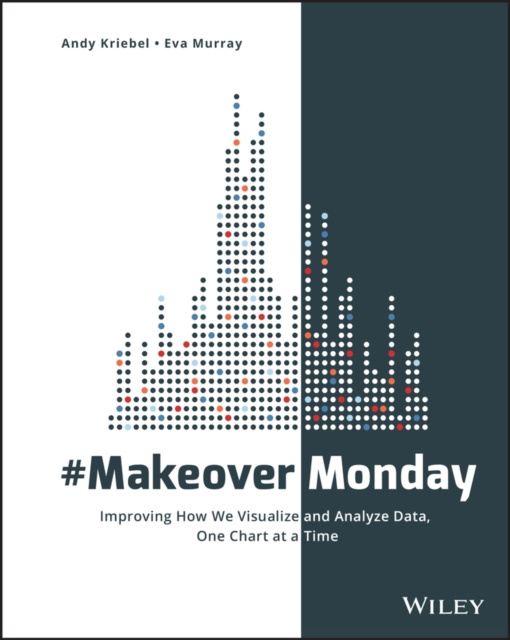
Explore different perspectives and approaches to create more effective visualizations #MakeoverMonday offers inspiration and a giant dose of perspective for those who communicate data. Originally a small project in the data visualization community, #MakeoverMonday features a weekly chart or graph and a dataset that community members reimagine in order to make it more effective. The results have been astounding; hundreds of people have contributed thousands of makeovers, perfectly illustrating the highly variable nature of data visualization. Different takes on the same data showed a wide variation of theme, focus, content, and design, with side-by-side comparisons throwing more- and less-effective techniques into sharp relief. This book is an extension of that project, featuring a variety of makeovers that showcase various approaches to data communication and a focus on the analytical, design and storytelling skills that have been developed through #MakeoverMonday. Paging through the makeovers ignites immediate inspiration for your own work, provides insight into different perspectives, and highlights the techniques that truly make an impact. Explore the many approaches to visual data communication Think beyond the data and consider audience, stakeholders, and message Design your graphs to be intuitive and more communicative Assess the impact of layout, color, font, chart type, and other design choices Creating visual representation of complex datasets is tricky. There’s the mandate to include all relevant data in a clean, readable format that best illustrates what the data is saying—but there is also the designer’s impetus to showcase a command of the complexity and create multidimensional visualizations that “look cool.” #MakeoverMonday shows you the many ways to walk the line between simple reporting and design artistry to create exactly the visualization the situation requires.


À propos du livre
Anglais

Offrez ce livre dès aujourd'hui
C’est simple
1 Ajouter au panier et choisir l'option Livrer comme cadeau à la caisse. 2 Nous vous enverrons un bon d'achat 3 Le livre arrivera à l'adresse du destinataireCeci pourrait également vous intéresser

Bonjour ! Je suis Libroamiko, votre conseiller littéraire.
Comment puis-je vous aider ?