
 Contact
 Comment faire ses achats
Livraison
Guide d'achat
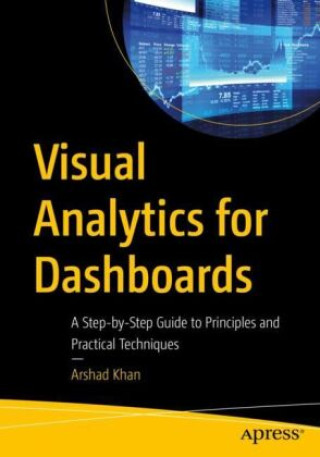
Visual Analytics for Dashboards
A Step-by-Step Guide to Principles and Practical Techniques
 Anglais
 61 b
61 b
Jusqu'à 30 jours pour les retours
Les clients ont également acheté

 /
/
 Livre de poche
 71.10
€
71.10
€










 /
Livre relié
69.18
€
/
Livre relié
69.18
€



 /
Livre relié
10.92
€
/
Livre relié
10.92
€

 /
Livre de poche
36.71
€
/
Livre de poche
36.71
€




This book covers the key principles, best practices, and practical techniques for designing and implementing visually compelling dashboards. It explores the various stages of the dashboard development process, from understanding user needs and defining goals, to selecting appropriate visual encodings, designing effective layouts, and employing interactive elements. It also addresses the critical aspect of data storytelling, examining how narratives and context can be woven into dashboards to deliver impactful insights and engage audiences.Visual Analytics for Dashboards is designed to cater to a wide range of readers, from beginners looking to grasp the fundamentals of visual analytics, to seasoned professionals seeking to enhance their dashboard design skills. For different types of readers, such as a data analyst, BI professional, data scientist, or simply someone interested in data visualization, this book aims to equip them with the knowledge and tools necessary to create impactful dashboards.What you'll learnThe principles of data visualizationHow to create effective dashboards.Meet all the requirements for visual analytics/data visualization/dashboard courses.Deepen understanding of data presentation and analysis.How to use different kinds of tools for data analysis, such as scorecards and key performance indicators. Who This Book Is ForBusiness analysts, data analysts, BI professionals, end-users, executives, developers, as well as students in dashboards, data visualizations, and visual analytics courses.


À propos du livre
Anglais

Offrez ce livre dès aujourd'hui
C’est simple
1 Ajouter au panier et choisir l'option Livrer comme cadeau à la caisse. 2 Nous vous enverrons un bon d'achat 3 Le livre arrivera à l'adresse du destinataireCeci pourrait également vous intéresser








 /
Livre de poche
33.57
€
/
Livre de poche
33.57
€









 /
Livre relié
120.57
€
/
Livre relié
120.57
€








Bonjour ! Je suis Libroamiko, votre conseiller littéraire.
Comment puis-je vous aider ?